In today's dynamic business landscape, staying ahead in the sales game requires more than just intuition—it demands data-driven insights. Enter BI Dashboards, the secret weapon to boost your sales performance and elevate your team's success.

Revealing the Power of Sales Data: Its Significance in Driving Sales Performance
In the dynamic realm of Sales Management, the quest for data takes center stage, especially when steering through the landscapes of organizations with a robust sales force. This exploration aims to unveil the motivations behind the relentless pursuit of sales data by sales professionals and, more importantly, why this pursuit is crucial in the context of organizations with a significant sales team.
Delving into the nuances of utilizing sales data in organizations with a large sales force, we seek to unravel how this data mosaic becomes an indispensable asset. From sales dynamics and customer engagement strategies to performance assessment and resource allocation, each strand in this intricate tapestry plays a pivotal role in shaping the trajectory of effective Sales Management.
Embark on this enlightening journey as we uncover the distinctive challenges and opportunities that surface when overseeing a substantial sales force. Explore why sales professionals, particularly in organizations with a sizable sales team, not only seek but essentially thrive on the abundance of sales data at their disposal. This exploration will shed light on the vital role that data plays in navigating the intricacies of managing a significant sales force, transforming information into a strategic advantage for organizational success.
Important Key Performance Indicators (KPIs) for Sales Dashbaord
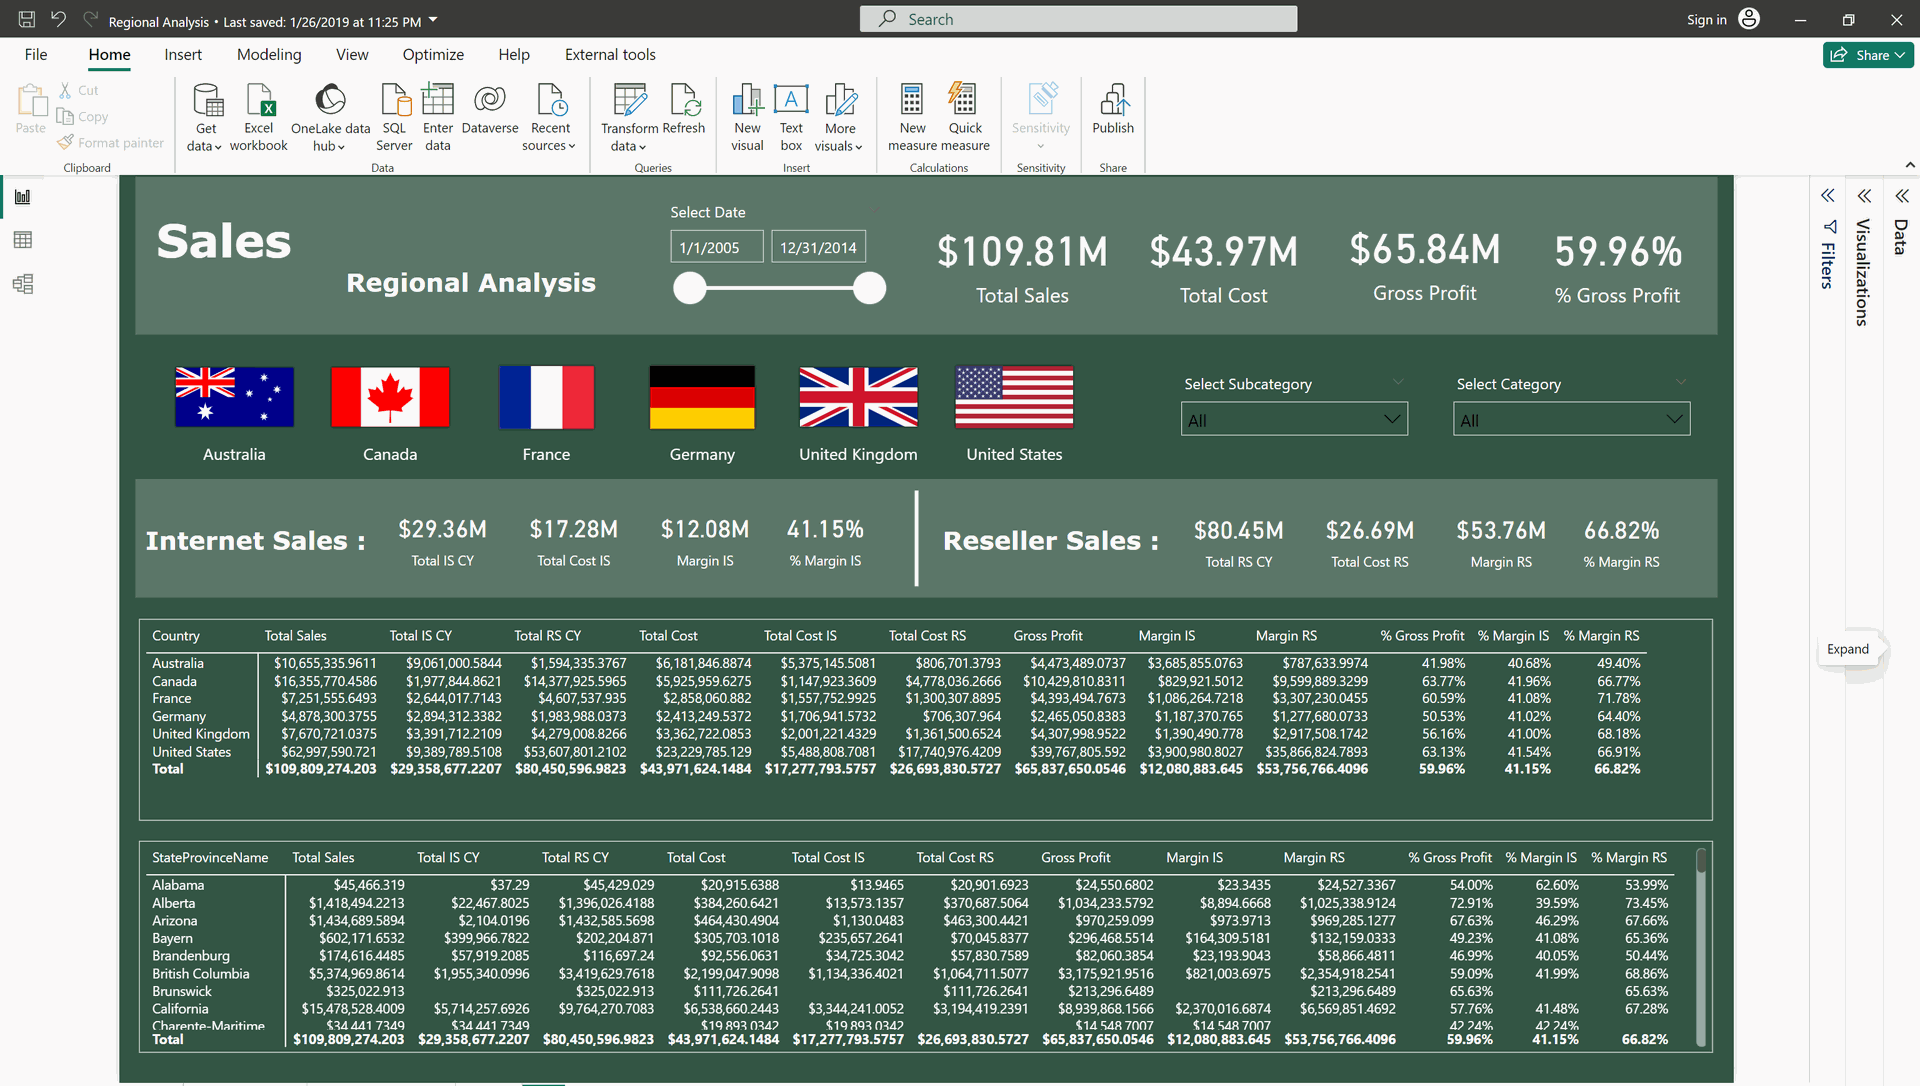
Sales Report Dashboard Regional Analysis View
Sales Management is gaining granular insights through regional analysis is crucial for optimizing strategies and uncovering growth opportunities. A well-crafted sales report dashboard, equipped with key performance indicators (KPIs) tailored to regional nuances, can be a game-changer. Below, we explore common KPIs for regional sales analysis and how to calculate them.
Total Cost
Cumulative cost associated with producing or acquiring products sold during the specified time frame.
Total Sales
Sum of all sales transactions within the selected date range, providing an overview of overall revenue.
Gross Profit
Subtract the total cost from total sales, representing the profit generated before deducting other expenses.
% Gross Profit
(Gross Profit / Total Sales) * 100, expressing gross profit as a percentage of total sales. Providing insight into the efficiency of revenue generation.
Margin
(Gross Profit / Total Sales) * 100, representing the profit margin as a percentage. Indicating the profitability of sales after deducting the cost of goods sold.
% Margin
(Margin / Total Sales) * 100, expressing margin as a percentage of total sales. Offering a more nuanced perspective on overall profitability.
Types of Sales / Sales Medians
Sum of sales made through online channels within the selected date range.
Indicates the performance of online sales strategies. Sum of sales made through reseller or distribution channels during the specified time frame.
Helps evaluate performance in distribution networks.
By Country
Analyze total sales, cost, and profit figures grouped by different countries within the chosen date range. Facilitates understanding of sales dynamics in different geographical regions.
By State/Province Name
Drill down further into regional data by analyzing sales metrics at the state or province level. Enables a more localized analysis.
Select Date (From - To)
Coose a date range to analyze sales performance over a specific period, providing a comprehensive view of trends and fluctuations.
Filter (Select Category and Select Subcategory)
Apply filters to isolate data based on specific product categories and subcategories, allowing for targeted analysis.
Enables targeted analysis for more detailed insights.
Crafting a sales report dashboard with these regional analysis metrics equips businesses with the tools needed to make informed decisions, optimize resources, and strategically navigate diverse markets. Regularly reviewing and updating these metrics ensures ongoing relevance to the evolving business landscape. It's not just about data; it's about turning that data into actionable insights for sustained success.
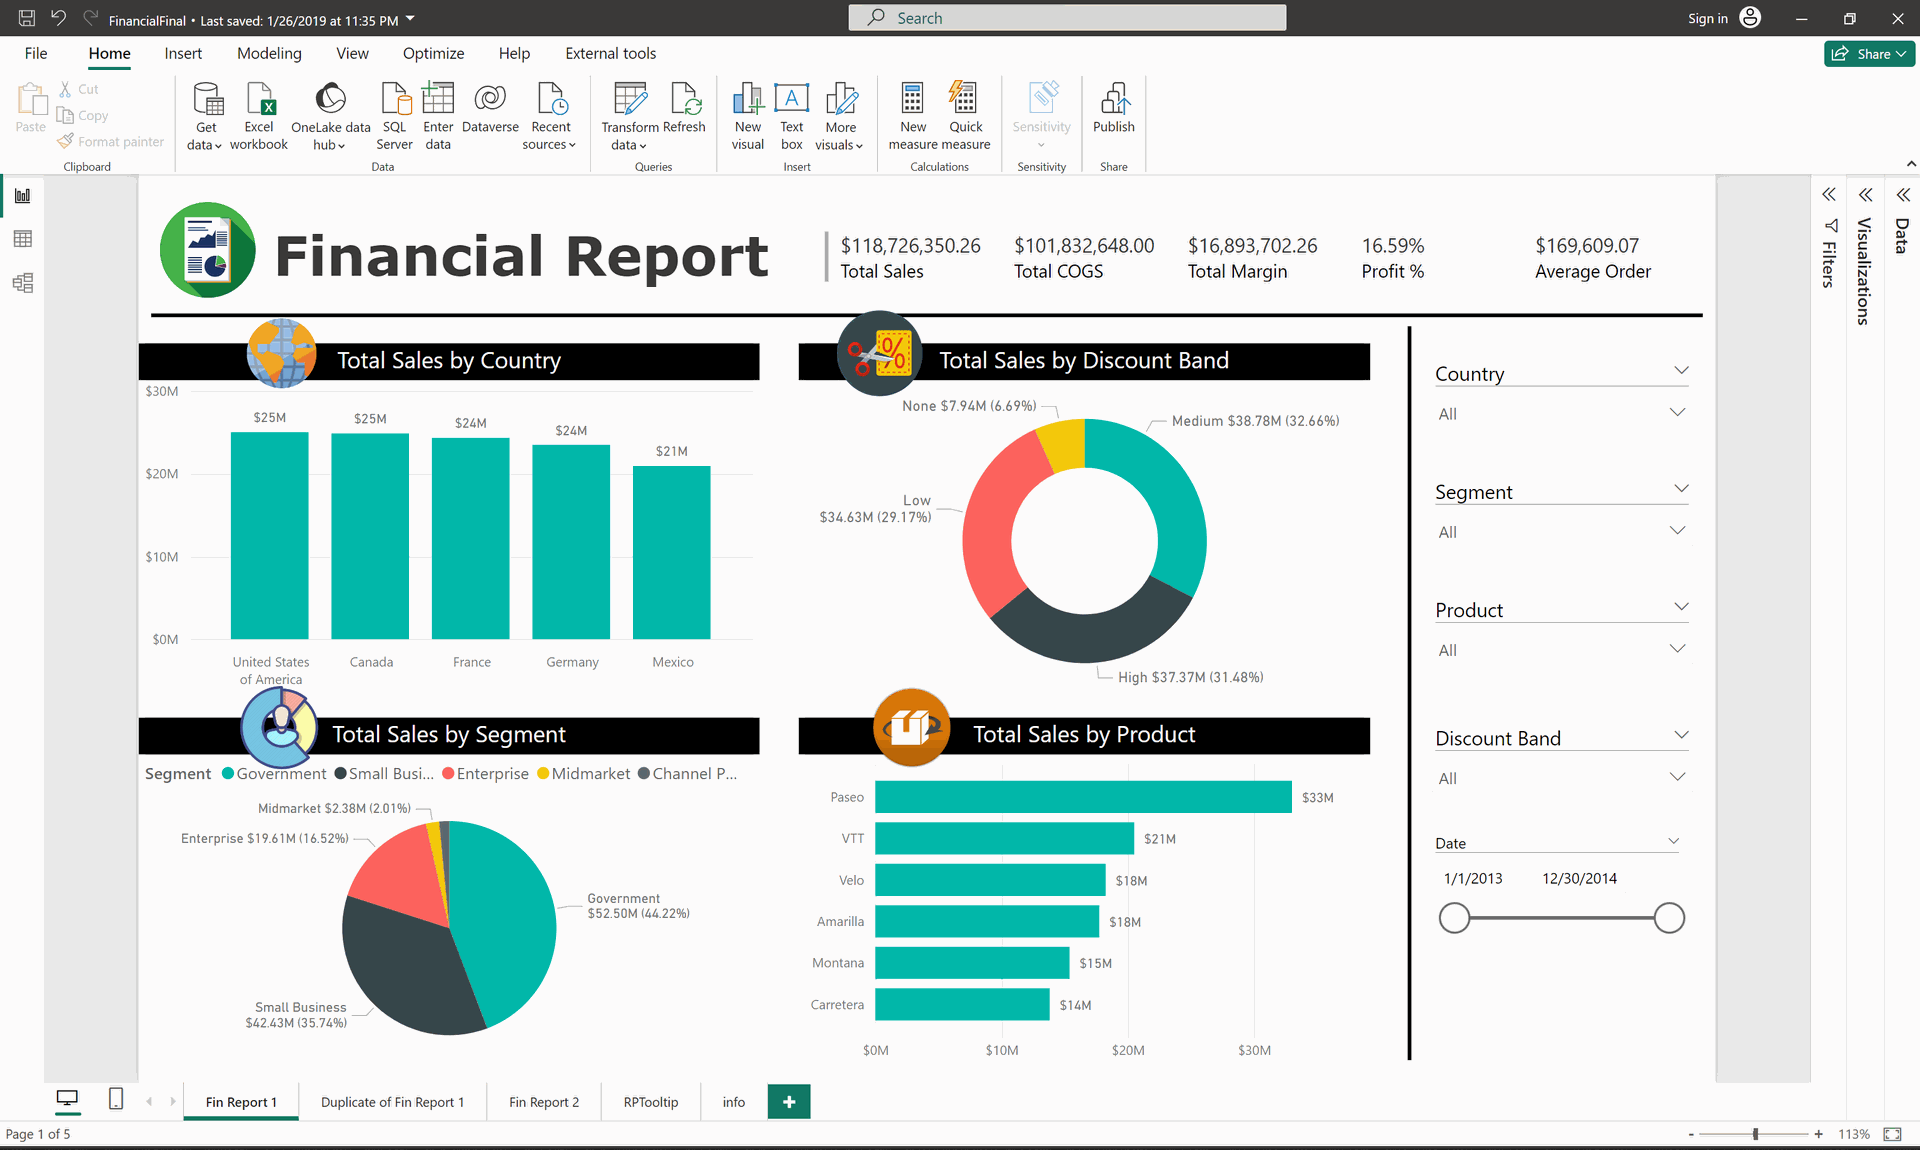
Financial Sales Report Analysis View
Financial Reporting is an effective dashboard tailored to sales analysis is indispensable for strategic decision-making and financial health assessment. Below, we delve into the Common Key Performance Indicators (KPIs) crucial for financial success in Sales Management, along with detailed insights on how to calculate each metric.
Total Sales
The total sales metric is calculated by summing all sales transactions within the chosen date range. This metric provides an overview of overall revenue generated during that specific period.
Total COGS (Cost of Goods Sold)
This metric involves calculating the cumulative cost associated with producing or acquiring products sold during the specified time frame.
Total Margin
The total margin is determined by finding the difference between total sales and total COGS. It indicates the overall profit generated from sales.
Profit in %
Calculated as (Total Margin / Total Sales) * 100, this metric expresses profit as a percentage of total sales, providing insight into the profitability of sales activities.
Average Order
Calculated as Total Sales divided by the Number of Orders, this metric provides the average value of each order. It is valuable for understanding customer purchasing behavior.
Return on Investment (ROI)
ROI is calculated as ((Total Sales - Total COGS) / Total COGS) * 100. This metric indicates the return generated relative to the cost of goods, helping assess the effectiveness of investments.
Net Profit Margin
Expressed as (Total Sales - Total COGS) / Total Sales * 100, the net profit margin indicates net profit as a percentage of total sales. It provides a deeper understanding of overall profitability.
Sales Growth Rate
Measured as ((Current Sales - Previous Sales) / Previous Sales) * 100, this metric assesses the percentage increase in sales over time. It aids in identifying trends and forecasting future performance.
Sales Cycle Length
This metric involves determining the average time it takes to convert a lead into a sale. It provides insights into the efficiency of the sales process.
Filters (Country, Segment, Product, Discount Band)
These filters allow businesses to segment data based on geographical location, market segment, specific products, or discount bands. This segmentation facilitates targeted analysis for more nuanced insights.
Crafting a financial report dashboard with these sales analysis metrics empowers businesses to make informed financial decisions, optimize operational efficiency, and strategically plan for future growth. Regularly reviewing and updating these metrics ensures their relevance to the evolving financial landscape. It's not just about numbers; it's about transforming financial data into actionable insights for sustained financial success.
The Transformative Benefits of BI in Sales Management Dashboards
Sales Management is the integration of Business Intelligence (BI) into sales dashboards isn't just a technological upgrade; it's a strategic leap towards unparalleled success. Let's explore the transformative benefits that unfold when BI becomes the focal point in shaping sales dashboards, revolutionizing the way organizations drive their sales force and strategic sales initiatives.
Sales professionals thrive on data-driven decisions. BI in sales dashboards ensures access to insightful data, empowering decision-makers to make informed choices that drive sales growth and maximize revenue.
Transform complex sales data into visually appealing insights. Visual representations in sales dashboards enhance comprehension, enabling teams to quickly grasp trends, customer behaviors, and performance metrics for more effective decision-making.
In the fast-paced world of sales, real-time analytics are paramount. BI-equipped dashboards provide up-to-the-minute insights into sales performance, enabling agile adjustments to strategies and tactics to stay ahead in the competitive landscape.
In the fast-paced world of sales, real-time analytics are paramount. BI-Tailor your sales dashboards to align with specific sales goals. Customization features in BI allow organizations to focus on key performance indicators (KPIs) that matter most, ensuring targeted efforts for optimal results.
Optimize resource allocation with BI-driven insights. Sales dashboards provide a comprehensive view of resource utilization, helping organizations allocate manpower, budget, and time more efficiently for maximum sales impact.
Motivate and engage your sales team through data transparency. BI dashboards foster a culture of open communication by sharing performance metrics, recognition, and progress, boosting morale and overall employee engagement.
BI tools enable strategic sales planning by analyzing historical data and predicting future trends. Sales dashboards equipped with BI capabilities empower organizations to proactively plan for market shifts and emerging opportunities.
Equip your sales team with the tools they need for productivity. BI-driven insights in sales dashboards streamline processes, identify bottlenecks, and enhance overall team efficiency, driving increased productivity.
Ensure adherence to sales regulations and manage risks effectively. BI in sales dashboards provides a comprehensive overview of compliance metrics, enabling organizations to mitigate risks and navigate regulatory challenges proactively.
Transform your sales culture with a data-driven mindset. BI integration fosters a culture where data is at the forefront of decision-making, ensuring that every action is backed by meaningful insights for continuous improvement.
The infusion of Business Intelligence into sales dashboards is a game-changer, empowering organizations to not only manage their sales force more efficiently but also to strategically elevate sales practices. Join us on a journey where data meets strategy, and sales excellence becomes not just a goal but a tangible reality.

Elevating Sales Management with Regional Analysis Dashboards
Sales Management is the integration of location analysis dashboards is a catalyst for strategic advancements. Let's explore how Sales Management can harness this data to make targeted enhancements, considering the diverse market nuances and dynamics across different locations.
Sales Boost through Data-Driven Insights:
Targeted Market Strategies
Leverage data on customer behavior in various locations to formulate targeted market strategies. Tailor sales approaches based on regional preferences and purchasing patterns.
Regional Product Customization
Customize products or services based on location-specific data. Adapt offerings to meet the unique needs and preferences of customers in diverse markets.
Adaptive Pricing Models
Analyze data to develop adaptive pricing models that align with the economic landscapes of different locations. Ensure that pricing strategies resonate with local market conditions.
Localized Promotional Campaigns
Tailor promotional campaigns according to regional trends and events. Utilize data insights to create marketing initiatives that resonate with the cultural dynamics of each location.
Example: West Coast vs. East Coast Sales Strategies:
Consider a scenario where sales data reveals distinct preferences between customers on the West Coast and the East Coast. In response, Sales Management may implement targeted strategies such as:
On the West Coast, where a tech-savvy customer base is prominent, digital marketing and online engagement could be prioritized.
On the East Coast, where a more traditional approach may be appreciated, in-person events and relationship-building initiatives might be emphasized.
By utilizing location analysis dashboards, Sales Management professionals can make informed decisions that not only align with regional diversity but also drive enhanced sales performance and customer satisfaction.
The infusion of Business Intelligence into sales management practices is a transformative journey. It empowers organizations to harness the full potential of their data, make strategic decisions, and elevate sales practices for sustained success. Join us on this journey where data meets strategy, and sales excellence becomes a tangible reality.
Other Blogs
Frequently Asked Questions (FAQs)
The pursuit of sales data is crucial as it provides valuable insights into sales dynamics, customer engagement strategies, performance assessment, and resource allocation. Sales professionals thrive on this data to navigate the intricacies of managing a substantial sales force, transforming information into a strategic advantage for organizational success.
The blog post outlines several important KPIs for Sales Dashboards, including Total Cost, Total Sales, Gross Profit, % Gross Profit, Margin, % Margin, Types of Sales/Sales Medians, By Country, By State/Province Name, Select Date (From - To), and Filter (Select Category and Select Subcategory).
The blog suggests using regional analysis KPIs to gain granular insights, optimize strategies, and uncover growth opportunities. By crafting a well-designed sales report dashboard with these metrics, businesses can make informed decisions, optimize resources, and strategically navigate diverse markets.
Filters allow businesses to isolate data based on specific product categories and subcategories, enabling targeted analysis for more detailed insights. This customization facilitates a deeper understanding of product performance and market dynamics.
Business Intelligence infusion into sales management practices is a transformative journey that empowers organizations to harness the full potential of their data, make strategic decisions, and elevate sales practices for sustained success. It fosters a culture where data is at the forefront of decision-making, ensuring every action is backed by meaningful insights for continuous improvement.