In the fast-paced realm of IT support, effective ticket analysis is paramount for ensuring streamlined operations and swift issue resolution. Embracing Business Intelligence (BI) Dashboards emerges as a powerful strategy to revolutionize how IT departments handle and analyze tickets. Let's explore how BI Dashboards can be the key to enhancing efficiency and gaining valuable insights in the dynamic landscape of IT Ticket Analysis.
Unveiling the Power of IT Ticket Data: Its Significance in Driving IT Operations
In the intricate world of IT management, the significance of data is unparalleled, especially when navigating through the myriad challenges presented by an influx of IT tickets. This exploration aims to shed light on the motivations behind the relentless pursuit of IT ticket data by IT professionals and why this pursuit is crucial for organizations with a substantial IT workload.
Delving into the nuances of utilizing IT ticket data, we seek to unravel how this data mosaic becomes an indispensable asset. From identifying recurring issues and performance bottlenecks to resource allocation and trend analysis, each piece of information contributes to the holistic understanding of IT operations.
Embark on this enlightening journey as we uncover the unique challenges and opportunities that arise when managing a significant IT workload. Explore why IT professionals thrive on the abundance of IT ticket data, transforming it into a strategic advantage for efficient IT operations and organizational success.
Key Performance Indicators (KPIs) for IT Ticket Analysis Dashboard
To effectively measure and analyze IT ticket data, it's crucial to understand how to calculate key metrics that provide valuable insights into the performance of the IT department. Here's a detailed guide on calculating the specified metrics for your IT Ticket Analysis Dashboard:
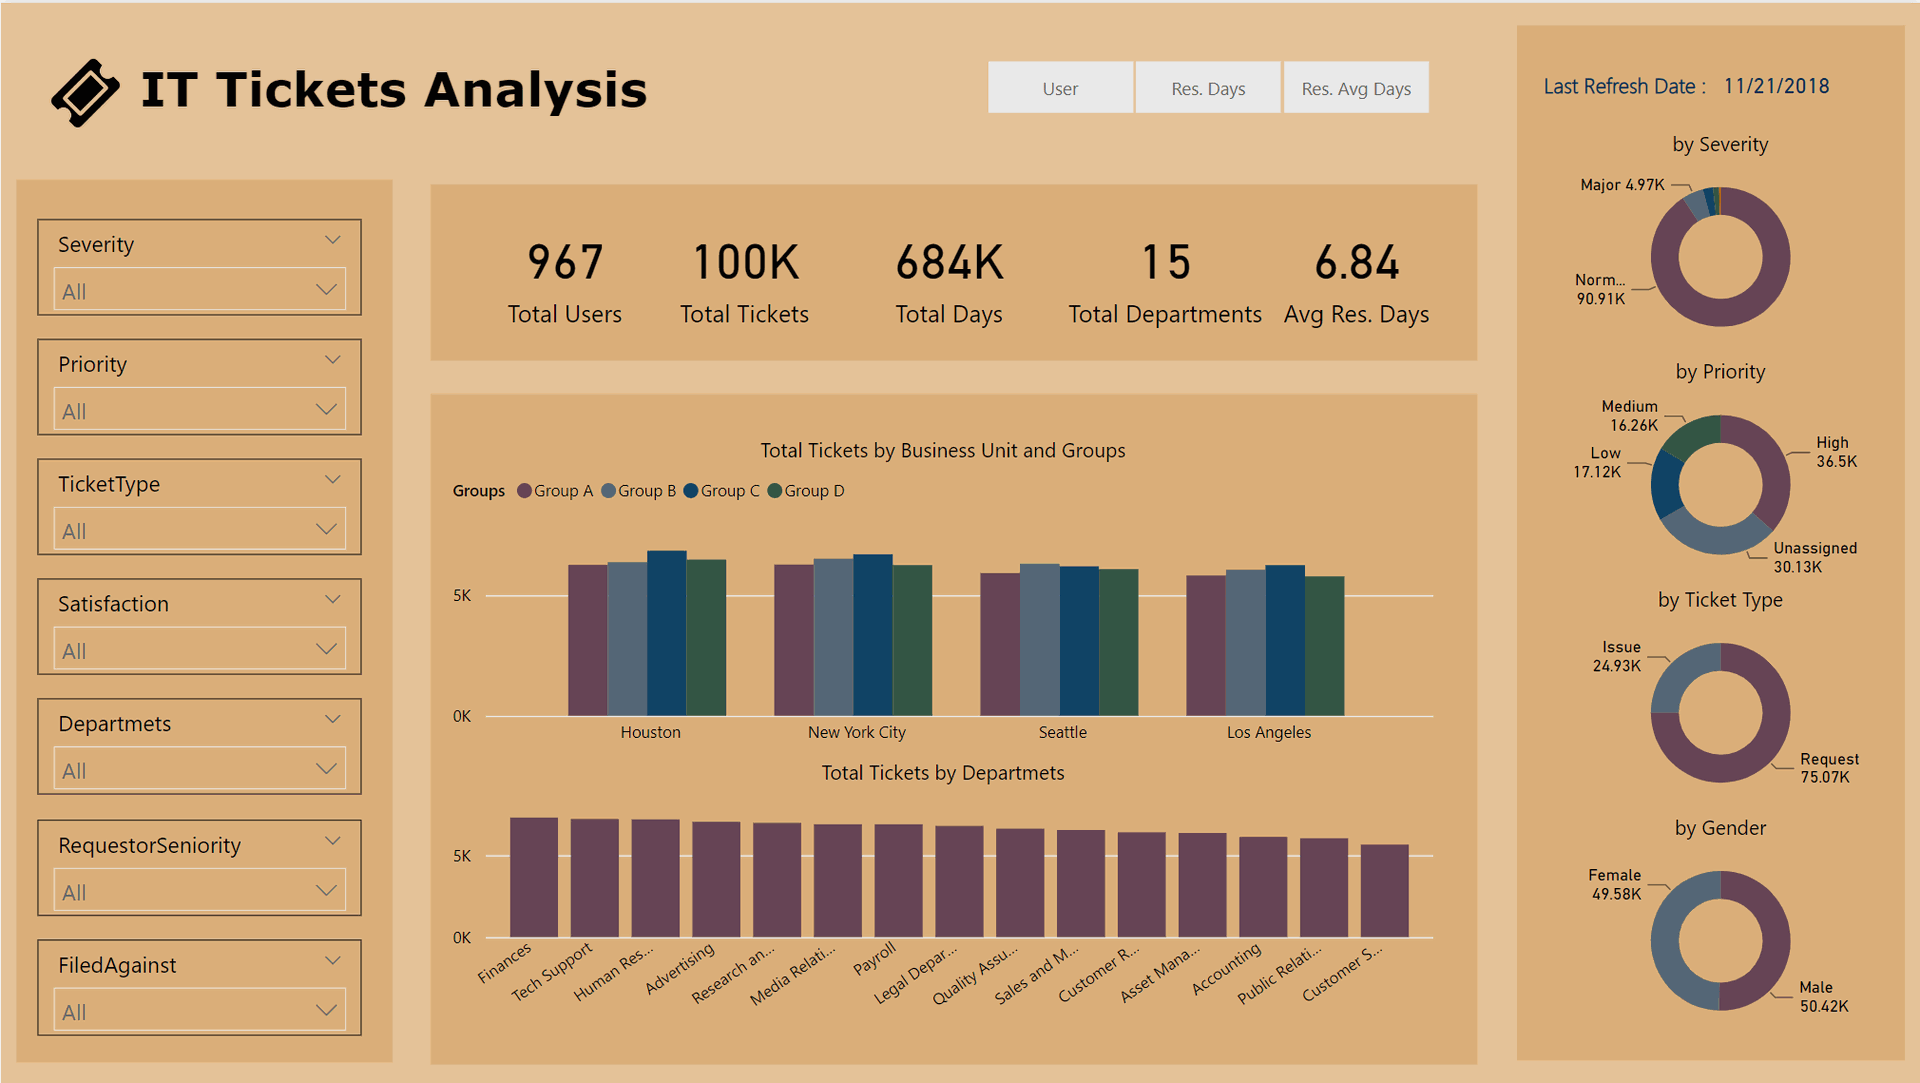
Total Users
Techniques for accurately counting and identifying unique users in IT ticket data.
Total Tickets
Analyzing trends in total ticket submissions over time helps organizations recognize seasonal patterns and outliers, ensuring effective resource allocation.
Total Days
Sum the total number of days taken to resolve all IT tickets.
Total Department
Evaluating different departments' IT support efficiency identifies areas for improvement and fosters collaboration, promoting knowledge sharing.
Avg Res. Days
Calculate the average resolution days for IT tickets is expressed as follows: divide the total days by the total number of tickets, yielding the result for Avg Res. Days.
Total Business Unit and Groups
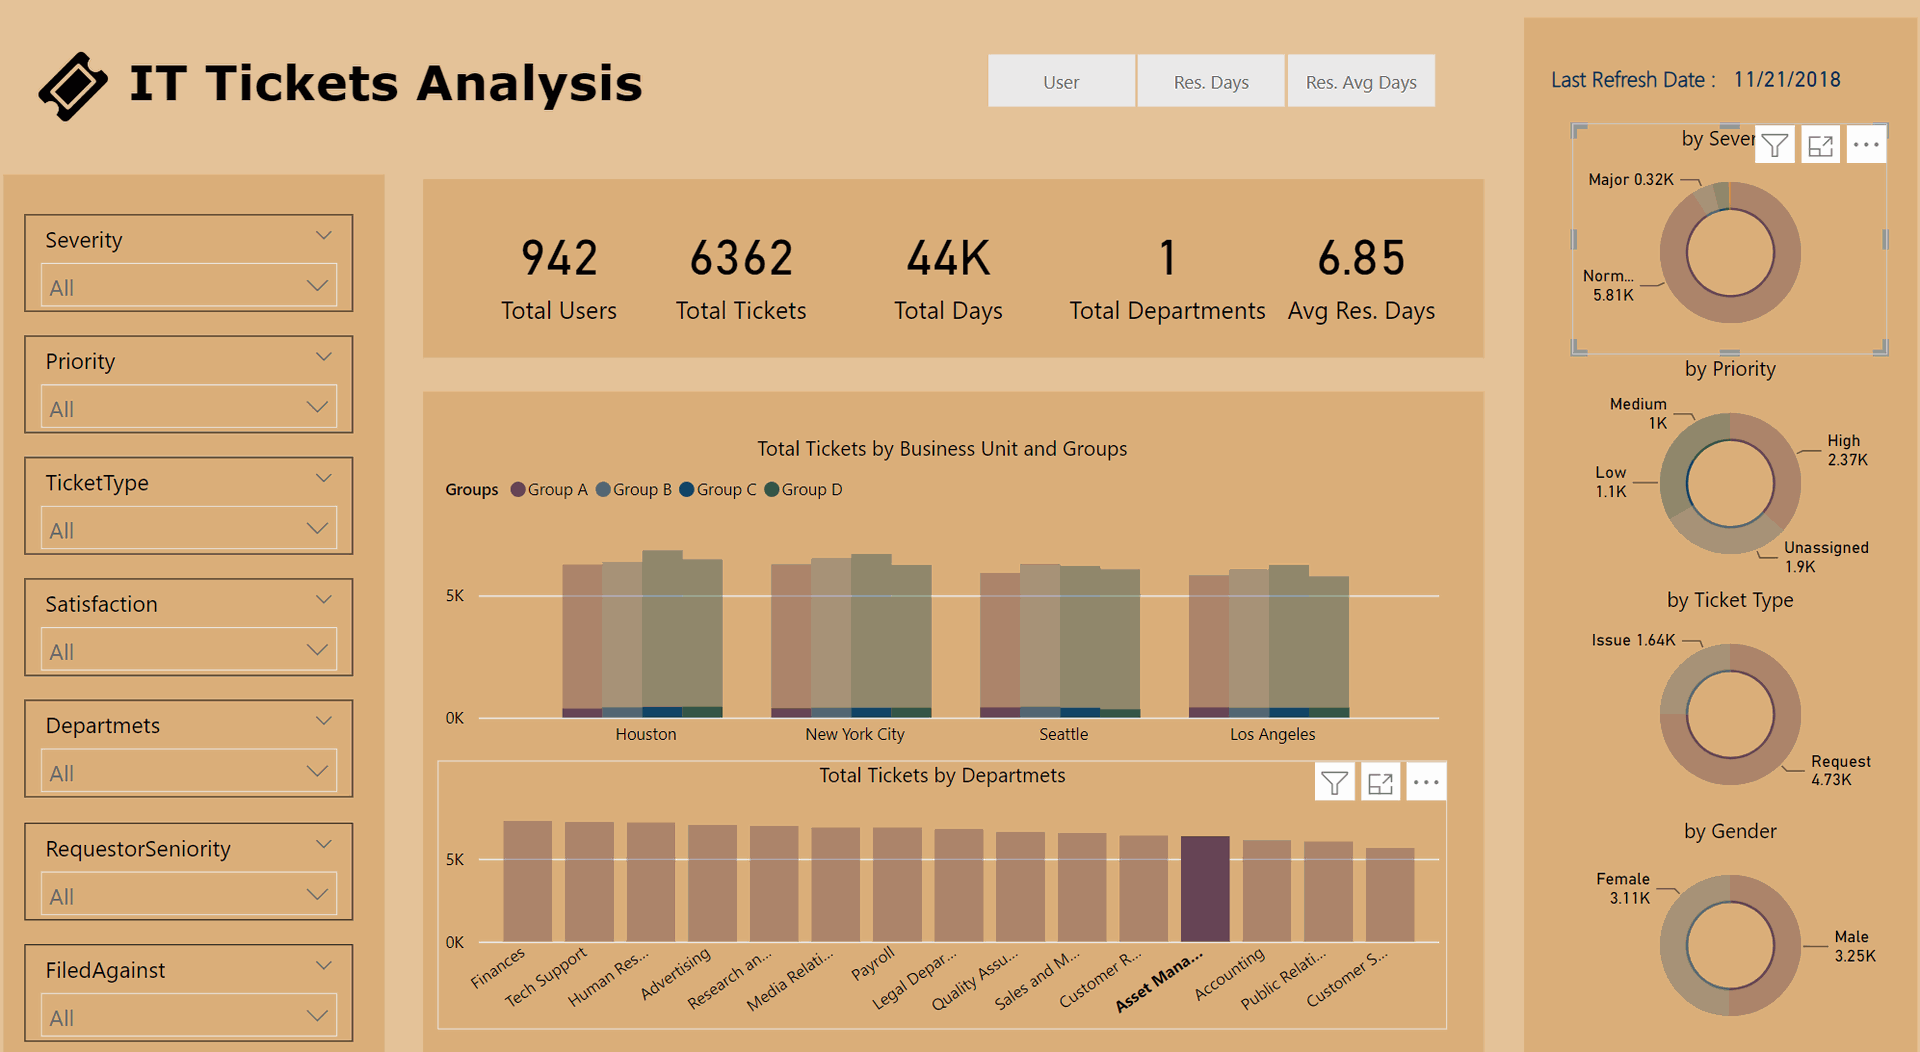
Showing ticket distribution across four groups in different cities including Houston, New York City, Seattle and Los Angeles.
Total Tickets by Department
Count the total number of IT tickets submitted by each department.
Choose the Dashboard viewing option for Section View:

- User: This metric represents the individual users submitting IT tickets.
- Res. Days: The total number of days it takes to resolve an IT ticket.
- Res. Avg Days: The average number of days taken to resolve IT tickets.
Specified Filters:
Utilize the specified filters to segment data based on Severity, Priority, Ticket Type, Satisfaction, Department, Requestor Seniority, and Filed Against.
Severity - Critical, Major, Minor, Normal, Unclassified:
Count the number of IT tickets classified under each severity level.


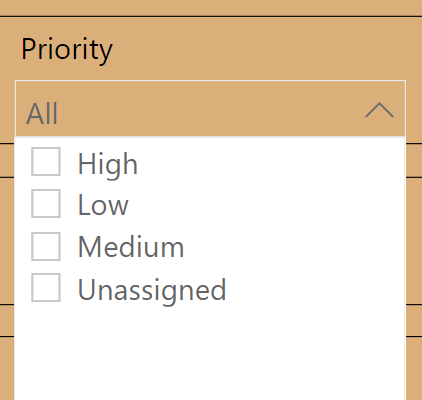
Priority - High, Low, Medium, Unassigned:
Count the number of IT tickets classified under each priority level.
Satisfaction - Highly Satisfied, Satisfied, Unknown, Unsatisfied:
Count the number of IT tickets based on user satisfaction levels.

- Ticket Type: Count the number of IT tickets based on their type (e.g., incident, service request).
- Department: Count the number of IT tickets submitted by each department.
- Requestor Seniority: Count the number of IT tickets based on the seniority level of the requester.
- Filed Against: Count the number of IT tickets filed against specific entities or components.
Crafting a financial analysis dashboard with these IT Ticket Analysis KPIs empowers IT departments to make informed financial decisions, optimize operational efficiency, and strategically plan for future growth. Regularly reviewing and updating these KPIs ensures their relevance to the evolving financial landscape. It's not just about numbers; it's about transforming financial data into actionable insights for sustained financial success.
The Transformative Benefits of BI in IT Ticket Analysis Dashboards
The integration of Business Intelligence (BI) into IT Ticket Analysis Dashboards brings about transformative benefits, revolutionizing the way organizations manage and derive insights from their IT support operations. This strategic integration goes beyond being a mere technological upgrade; it serves as a catalyst for unparalleled success. Here are some of the transformative benefits:
BI empowers IT professionals to make informed decisions by providing access to real-time, data-driven insights. Decision-makers can rely on comprehensive analytics to understand trends, identify patterns, and strategically address challenges in IT ticket resolution.
The visual representation of data through BI dashboards enhances understanding. Complex IT ticket data is transformed into intuitive charts, graphs, and visuals, enabling quick comprehension of trends, performance metrics, and critical information.
BI enables real-time analytics, allowing IT departments to respond promptly to emerging trends and issues. Agile strategies can be implemented based on up-to-the-minute data, ensuring adaptability and responsiveness to the dynamic nature of IT operations.
BI dashboards offer customization options, allowing organizations to tailor analytics to specific IT objectives. Whether focusing on resolution time, user satisfaction, or departmental performance, BI provides the flexibility to align analytics with organizational priorities.
BI tools facilitate efficient resource allocation by offering insights into workload distribution, departmental efficiency, and ticket resolution times. IT departments can optimize staffing and allocate resources strategically, ensuring a balanced and effective approach to IT support.
BI dashboards contribute to enhanced employee engagement by providing visibility into individual and team performance. Recognizing and rewarding high-performing teams becomes more accessible, fostering a positive and motivated work environment.
BI supports strategic IT planning by offering a comprehensive view of historical and real-time data. Organizations can identify areas for improvement, plan for future IT initiatives, and align their IT strategies with broader business goals.
The data-driven insights provided by BI dashboards contribute to increased productivity. IT professionals can focus efforts on areas that matter most, address bottlenecks, and streamline processes for more effective IT support operations.
BI tools aid in compliance and risk management by providing visibility into IT ticket data. Organizations can track compliance with service level agreements (SLAs), assess potential risks, and proactively address issues before they escalate.
The infusion of BI promotes a data-driven IT culture within organizations. Teams become accustomed to leveraging data for decision-making, fostering a mindset where insights derived from IT ticket analysis are integral to the overall operational strategy.
The transformative benefits of BI in IT Ticket Analysis Dashboards underscore its role as a strategic enabler, empowering organizations to achieve heightened efficiency, agility, and success in managing IT support operations.
Conclusion
The amalgamation of BI Dashboards, insightful KPIs, and a deep understanding of IT ticket data paves the way for IT departments to not only navigate challenges efficiently but to proactively shape the future of IT support. It's a journey where data becomes a strategic asset, empowering organizations to stay ahead in the ever-evolving landscape of IT operations. As we embrace the transformative power of BI, the future of IT management is one of informed decisions, streamlined operations, and sustained success.
Other Blogs
Frequently Asked Questions (FAQs)
BI Dashboards provide a powerful strategy for transforming how IT departments handle and analyze tickets. They offer real-time analytics, visualized insights, and customization options, empowering organizations to make informed decisions and enhance overall efficiency.
IT professionals thrive on the abundance of IT ticket data as it becomes a strategic advantage. They can transform this data into actionable insights for efficient IT operations and contribute to organizational success.
The integration of BI brings transformative benefits, including informed decision-making, visualized insights, real-time analytics, customization options, efficient resource allocation, enhanced employee engagement, strategic planning, increased productivity, compliance and risk management, and the promotion of a data-driven IT culture.
Regularly reviewing and updating IT Ticket Analysis KPIs ensures their relevance to the evolving financial landscape. This ongoing assessment allows organizations to adapt KPIs to changing business priorities and goals.
The future of IT management is one of informed decisions, streamlined operations, and sustained success as organizations embrace the transformative power of BI. This strategic integration empowers IT departments to proactively shape the future of IT support, staying ahead in the ever-evolving landscape of IT operations.

