In today's ever-evolving business landscape, procurement professionals are realizing that success in the procurement game requires more than just intuition—it demands data-driven insights. Enter Procurement Analytics Dashboards, the secret weapon to elevate your procurement performance and revolutionize your team's success.
Revealing the Power of Procurement Data: Its Significance in Driving Strategic Procurement
In the dynamic realm of Procurement Management, the quest for data takes center stage, especially when navigating through organizations with complex procurement needs. This exploration aims to unveil the motivations behind the relentless pursuit of procurement data by procurement professionals and, more importantly, why this pursuit is crucial in the context of organizations with intricate procurement processes.
Delving into the nuances of utilizing procurement data, we seek to unravel how this data mosaic becomes an indispensable asset. From supplier dynamics and cost optimization strategies to performance assessment and resource allocation, each strand in this intricate tapestry plays a pivotal role in shaping the trajectory of effective Procurement Management.
Embark on this enlightening journey as we uncover the distinctive challenges and opportunities that surface when overseeing complex procurement processes. Explore why procurement professionals, particularly in organizations with intricate procurement needs, not only seek but essentially thrive on the abundance of procurement data at their disposal. This exploration will shed light on the vital role that data plays in navigating the intricacies of managing complex procurement processes, transforming information into a strategic advantage for organizational success.
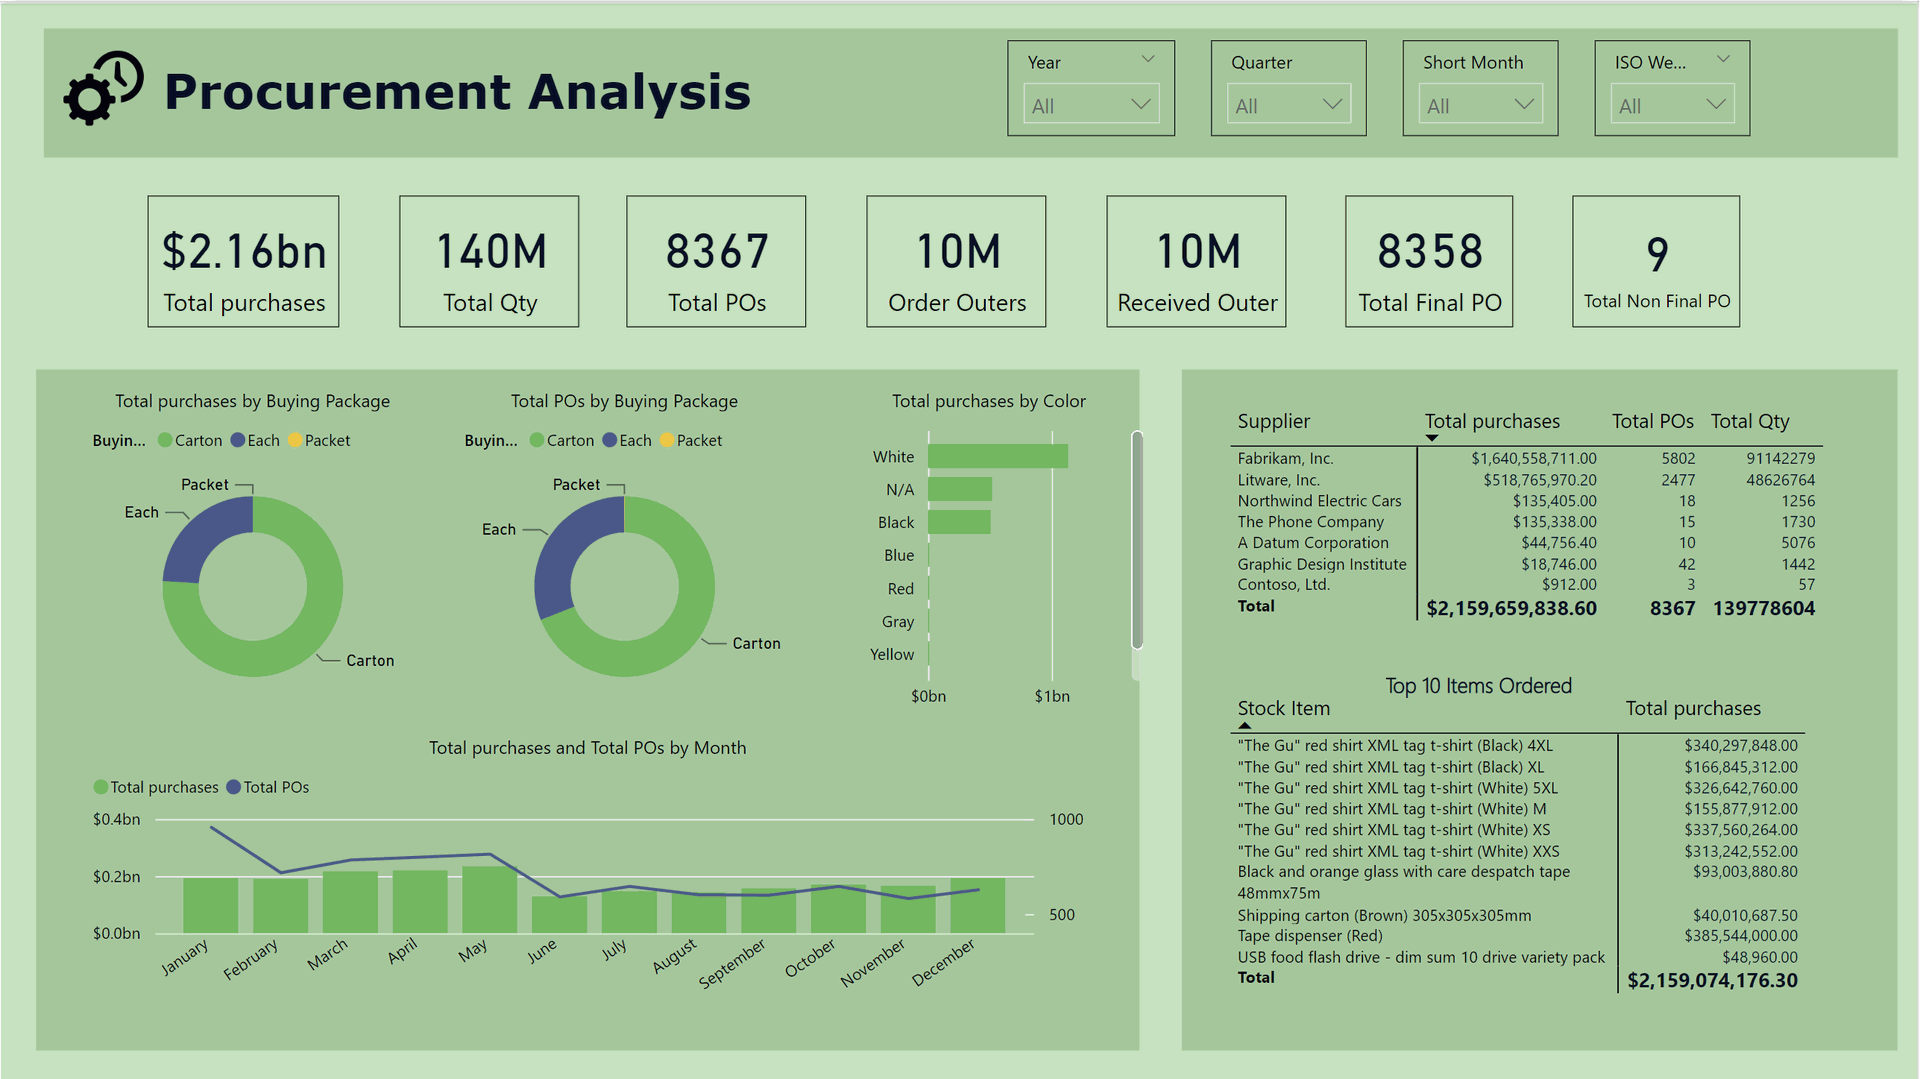
Important Key Performance Indicators (KPIs) for Procurement Analysis Dashboards
Procurement Management is the integration of Business Intelligence (BI) into procurement dashboards isn't just a technological upgrade; it's a strategic leap towards unparalleled success. Let's explore the transformative benefits that unfold when BI becomes the focal point in shaping procurement dashboards, revolutionizing the way organizations manage their procurement processes and strategic procurement initiatives.
Total Purchase
Measures the overall monetary value of procurement transactions, providing a holistic view of spending.
Total Quantity
Tracks the cumulative quantity of items procured, offering insights into procurement volume.
Total POs (Purchase Orders)
Counts the number of purchase orders generated, indicating the frequency of procurement activities.
Order Outers
Quantifies orders designated as "Outers," helping understand distribution across order types.
Received Outers
Counts successfully received orders marked as "Outers," evaluating order fulfillment efficiency.
Total Final PO
Counts purchase orders marked as "Final," reflecting completed or approved orders.
Total Non-Final PO
Counts purchase orders not marked as "Final," indicating orders in progress or pending approval.
Filters:
Year
Focuses on procurement data for a specific year, supporting annual performance analysis.
Quarter
Analyzes quarterly procurement performance, identifying seasonal trends.
Short Month
Examines procurement activities within a specific month, facilitating month-to-month comparisons.
ISO Week
Provides a granular view of procurement data based on ISO weeks, identifying weekly operational patterns.
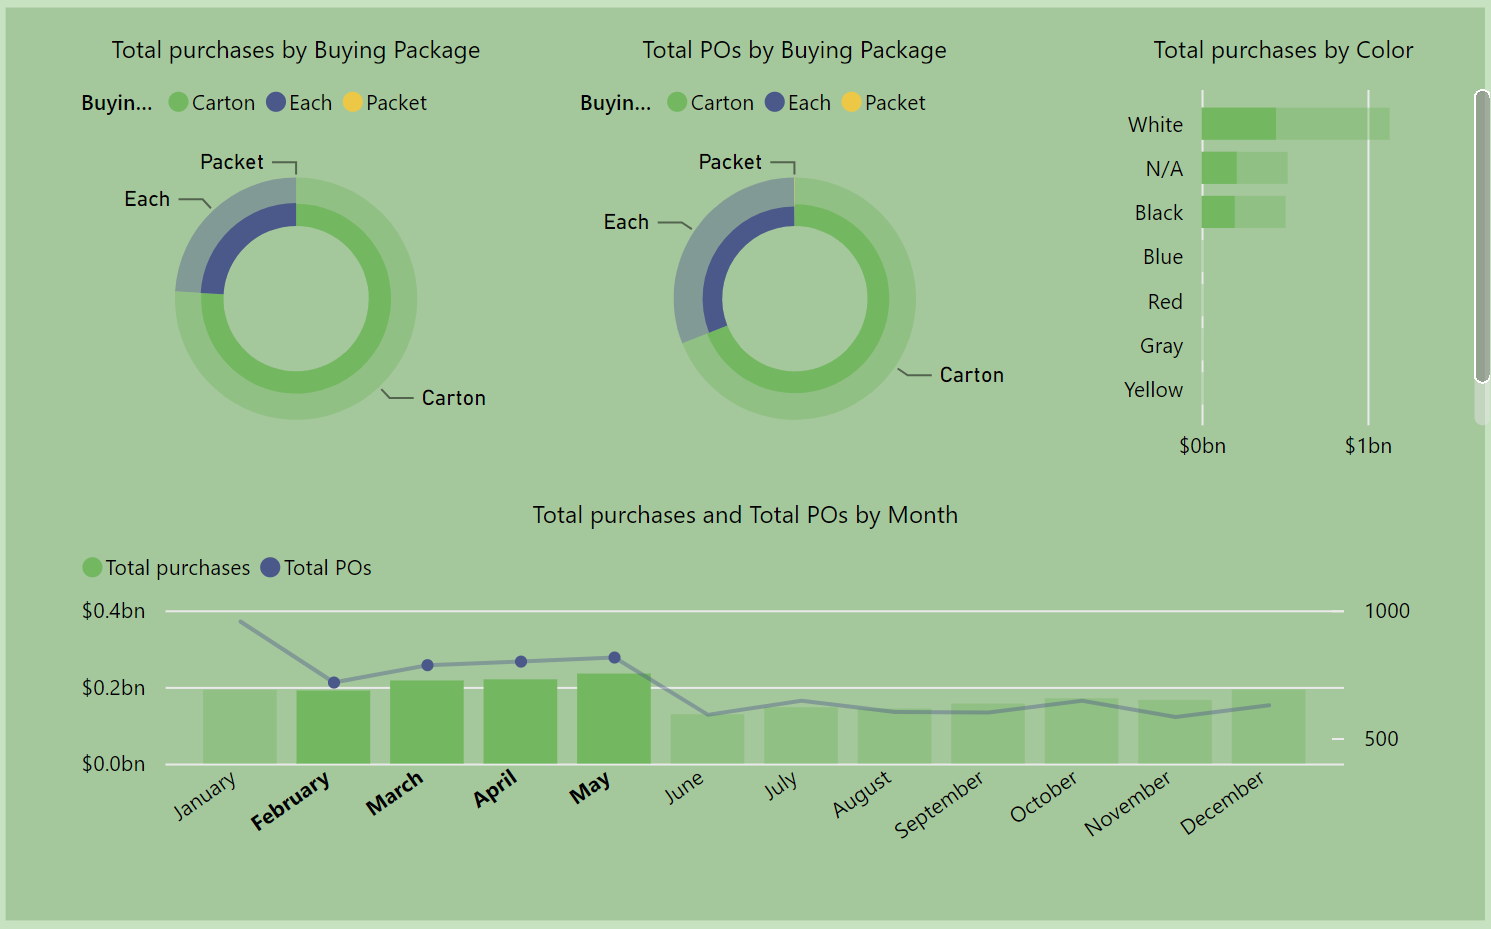
Graphs and Charts Analysis View

Total Purchase by Buying Package
Measures the total monetary value of procurement transactions based on different buying packages. Provides insights into the financial impact of specific product groupings, aiding strategic decision-making and inventory management.
Total POs by Buying Package
Counts the number of purchase orders generated for each buying package. Offers insights into the frequency of procurement activities for distinct product groups, supporting better planning and vendor engagement strategies.
Total Purchase by Color
Measures the overall monetary value of procurement transactions categorized by different colors. Provides insights into spending patterns based on color preferences or specifications, valuable for industries where color plays a significant role.
Total Purchase and Total POs by Month
Calculates the sum of the total monetary value of procurement transactions for each month. Counts the number of purchase orders generated for each month, offering insights into the monthly cadence of procurement activities and aiding in strategic planning.
Purchasing Orders Data View
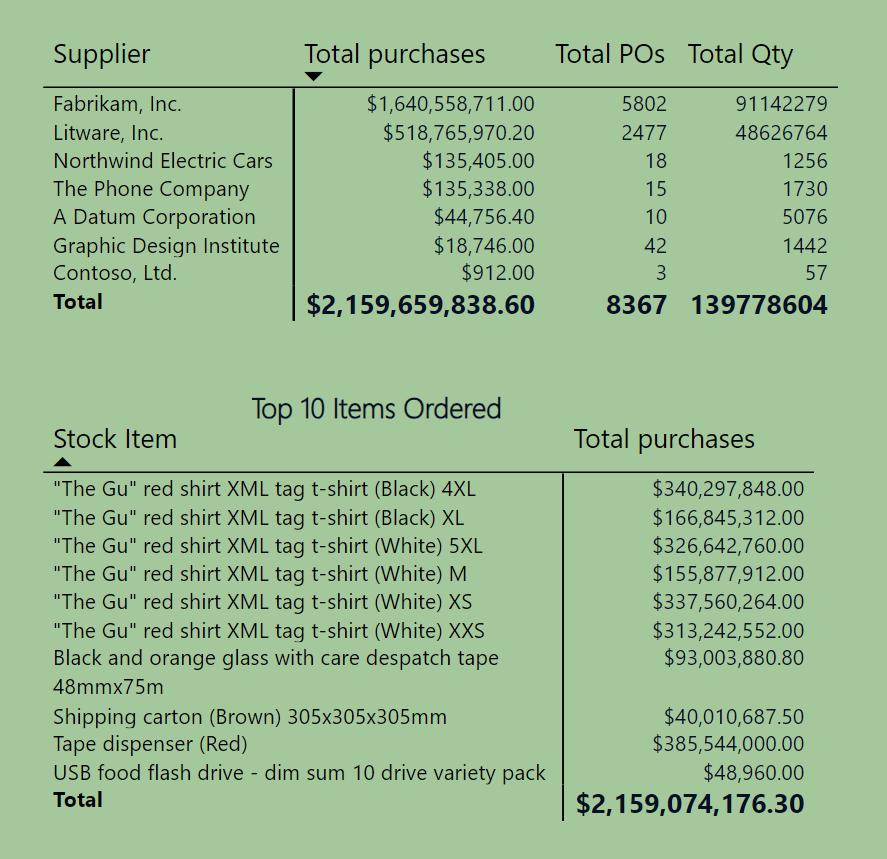
Supplier Metrics
Total Purchase from a Supplier
Measures the overall monetary value of procurement transactions from a specific supplier, indicating the financial impact of the supplier relationship.
Number of Purchase Orders from a Supplier
Counts the number of purchase orders generated for a specific supplier, providing insights into the frequency and activity of the procurement relationship.
Stock Item Metrics
Total Purchase of a Stock Item
Measures the total monetary value of procurement transactions for a specific stock item, reflecting the financial impact and significance of the item in operations.
Transformative Power of Business Intelligence in Procurement Management Dashboards
Procurement Management undergoes a revolutionary transformation with the integration of Business Intelligence (BI) into its dashboards. More than just a technological upgrade, this strategic leap propels organizations toward unparalleled success. Let's delve into the transformative benefits that unfold when BI takes center stage in shaping procurement dashboards, redefining how organizations manage procurement processes and strategic initiatives.
Dive into the ways BI empowers procurement professionals with data-driven insights, facilitating informed decision-making. Explore examples and case studies highlighting the impact of data-driven decisions on procurement strategies.
Explore the significance of visualization tools in BI for Procurement Management. Discuss how graphs, charts, and dashboards enhance understanding, making complex procurement data more accessible. Include practical tips on implementing effective visualization strategies.
Focus on the role of real-time analytics in BI-driven dashboards for agile procurement strategies. Discuss how real-time insights enable procurement teams to adapt swiftly to market changes, ensuring competitiveness and responsiveness.
Examine the customization capabilities of BI in procurement dashboards. Discuss the importance of tailored views and metrics to align with specific procurement objectives, fostering efficiency and ensuring strategic alignment within the organization.
Explore how BI fosters enhanced collaboration with suppliers. Discuss the visibility into performance metrics and data points, and how this enhanced engagement transforms vendor relationships into strategic partnerships, benefiting both parties.
The integration of Business Intelligence into procurement dashboards is a transformative journey. It empowers organizations to efficiently manage procurement processes, elevate strategic initiatives, and ultimately achieve procurement excellence. Join us on this journey where data meets strategy, and the vision of procurement excellence becomes a tangible reality.
Conclusion
The infusion of Business Intelligence (BI) into procurement dashboards transforms organizational strategies, enabling data-driven decisions and optimizing resources. Key Performance Indicators (KPIs) serve as a powerful toolkit, guiding informed decision-making and strategic alignment. Visualization, real-time analytics, and customization redefine the procurement landscape, fostering agility and responsiveness. Supplier engagement metrics signal a shift to collaborative partnerships, while granular analyses of buying patterns showcase BI's versatility. This journey signifies a paradigm shift towards procurement excellence, where data meets strategy for tangible organizational success.
Other Blogs
Frequently Asked Questions (FAQs)
Procurement Analytics Dashboards serve as a secret weapon, offering data-driven insights to elevate procurement performance and revolutionize team success in the dynamic and evolving business environment.
BI integration into procurement dashboards is not just a technological upgrade but a strategic leap. It transforms how organizations manage procurement processes, fostering efficiency, strategic initiatives, and ultimately achieving procurement excellence.
Graphs and Charts provide a visual understanding of procurement patterns, such as Total Purchase by Buying Package, Total POs by Buying Package, Total Purchase by Color, and Total Purchase and Total POs by Month, aiding strategic decision-making and inventory management.
The transformative power of BI lies in leveraging it for informed procurement decisions, enhancing understanding through visualization, catalyzing agile strategies with real-time analytics, tailoring dashboards for strategic objectives, and fostering collaboration, ultimately propelling organizations towards procurement excellence.
Organizations can join the journey by embracing BI integration, leveraging data for informed decisions, and aligning strategies with the vision of achieving procurement excellence.